


Looking at State Results
Second of Three Election Reviews

By Tom McMahan
Last week, I focused on our in-county results. This week we take a look at the state of our state.
Before I get into that, let me briefly address the questions swirling around our state Chair, Rep. Nikema Williams (GA-05). Williams seemed to indicate over the weekend that a new state Chair will be hired soon. It will be a full-time paid position, and this is welcome news. There have been numerous weak points in our state party’s structure for years now, and not having a dedicated, full-time Chair has been one of them.
Now, on with the state results.
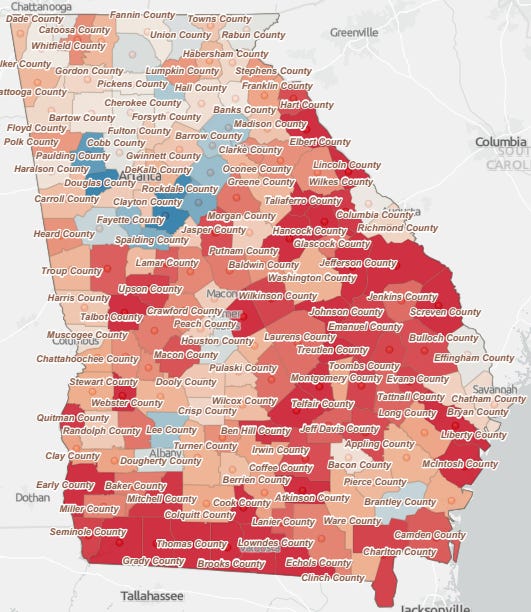
My focus tends to be on numbers, and I will provide the numbers in a series of four maps. So, our first map is a straightforward look at how Democratic each of our counties are following this election. This includes races all the way up and down the ballot, with the number of contested races and the average Democratic percentage in those races factored together.
NOTE: The maps used here are created from election data I took from the Georgia Secretary of State’s website. The maps are the visual byproducts of my use of that data, with a huge assist from my friend Kitty Cox, who used ArcGIS software to turn that data into the maps you see. I have deeper explanations for the data in the comments below, and feel free to ask questions or offer critiques in the comments as well. If you wish to use the maps, please source reference them as by Tom McMahan and Kitty Cox (Nov 2024).

For some time, majority Democratic counties in Georgia have been Metro Atlanta, the counties with the smaller cities across the state, and the rural counties that make up Georgia’s “black belt.” Pay particular attention to those more Democratic counties in east and southwest Georgia.
So, with our “keeping it real” map out of the way, let’s now look at how partisan voting shifted across the state, first in the Presidential election.
Some of the most significant shifts toward Republican voting occurred in the eastern Democratic counties across the black belt referenced in Map 1 above. Other large shifts occurred in the southwest. Some of the larger shifts were double-digit in nature, but most were just a few points. Metro counties largely held; inner Metro shifted red a little bit, but the outer Metro counties shifted blue, which means that some number of people are moving from inner Metro to outer Metro. Most northern counties, including Dade, didn’t shift that far Republican; a few shifted towards the Democrats. This in spite of record Republican turnout.
When we look at the same map, this time focusing on Congressional results, we get Map 3 below.

A significantly different look emerges here. Many of those red counties in southwest Georgia are blue here, and northwest Georgia looks considerably bluer. Eastern Georgia, while still “reddish” is more subdued.
All five of Georgia’s Democratic incumbent Representatives had higher vote totals than the Harris/Walz team in all or most of their Congressional districts. Only one non-incumbent Democratic Representative candidate outperformed Harris/Walz - Shawn Harris, CD-14. And that was in a very Republican district that was made a bit more Republican following the last election, and with record high Republican turnout. No Congressional incumbents of either party lost their races.
Finally, let’s move away from comparing D and R %’s and shifts, and let’s take a look at just Democratic vote totals, both Presidential and Congressional, compared to their last elections, and adjusted for voting population shifts.

For us locally, this is the best map of the four, of course! And it means even more that the counties up here pooled our resources and acted as one “mini coordinated campaign” for our area. I think this approach offers a better way forward for rural and small counties across Georgia, rather than waiting for the statewide campaign to come to town, or simply trying to act on your own. And I have to say thank you thank you thank you for all the volunteers we had in our 4-county effort, and also to Shawn Harris and his campaign for coming up with their strategic approach. Our 3 metro Chattanooga counties were top performers in this measurement, and I think the effectiveness of our canvassing, post carding, phone banking, and texting paid off wonderfully! Of course, I also have to acknowledge that our Republican opponents locally had a turnout just as large, but we made ourselves noticed for the first time in years here.
OBSERVATIONS AND CONCLUSIONS
In my role as vice-chair of the state party Rural Council, I am aware that there are a number of counties, particularly in east and south Georgia, that no longer have functioning Democratic committees. This has to change! The structural weakness that causes is, I think, contributing to our poor performance there. Having stronger committees, even in very Republican areas, and in Republican favorable elections, can help stem the tide of votes not going your way, or even reverse it in Democratic areas. Look for example, at how well Sanford Bishop (Dem) GA-02, did in reversing the Republican lean Presidentially in the counties of his district in Maps 2 and 3.
This election wasn’t so much a “Republican” shift in Georgia as it was a “Trump” shift or maybe more accurately an “anti Biden-Harris” shift. Incumbent congressmen and women didn’t face the same backlash because people don’t attach the same (mis) perceptions to members of Congress that they do the party in the White House on economic issues like high prices, which would seem to be the most obvious reason for high turnout for Trump in many areas, but nowhere near as high in Congressional races.
In spite of delivering the world’s best economy in the wake of COVID, and delivering many economic benefits to this state specifically, the Biden-Harris team got blamed for the post-pandemic price surge and it stuck. Prices, along with what I suspect is significant sexism (by both men and women) in regards to having a female president, and of course the massive propaganda machine on the Right, seems to have overwhelmed the Dobbs and anti-Trump effects.
Strong congressional campaigns, like that of Shawn Harris, are an absolute MUST! Our state party has to provide more support to our Democratic Congressional challengers, particularly in Republican areas or areas where local party infrastructure is weak. The tendency to just say “you’re on your own” with fundraising and the like has to stop. It does not take an enormous amount of money and resources to run an effective campaign in our more rural districts. Money that goes straight into county development and canvassing will return far more votes for the buck than will larger, more expensive consultant driven campaigns.
I’m interviewing and talking with people close to the Georgia Harris/Walz campaign as well as some of our Democratic Congressional candidates around the state. I’m not ready to share those results, but the picture I’m getting so far is very mixed. I will add more at a later time.
We need to replicate and improve upon our election efforts in 2026 here in our area. It will most likely be a much more Democratic friendly election, and we have Senator Ossoff to re-elect!
Next week, our third and final installment will look at the national picture.
Got an update on Map 4. First, I should have used a different color scheme on this map. Using the standard "blue/red" kind of shift is misleading, because people think "red = Republican" when, in this case, it really doesn't. "Red" on this map just indicated that your Democratic vote change over the past couple of elections didn't keep up with your population change.
So, for the first 67 counties (see the ranking in another comment below), the map works as it was intended. It also works as intended for counties who experienced Democratic vote decline (adjusted for population), which would be the bottom 56 counties. Having a red shade for those counties is probably ok, but I probably could have picked a better color.
But there's a group of 34 counties that really belong in an in-between range of their own. These counties experienced a growth in Democratic vote totals, but that growth was less than their registered voter population growth. What that means in their case is indeterminate, because it isn't clear how much of that growth is "true" growth (i.e. voters changing their voting patterns to include more Democratic voting), or how much is just the result of population growth (growth that will also add Republican voters in some mix that can't be accurately shown on this map.) I need to think of a different way of showing these counties on this map...a neutral color, maybe yellow...ish...I'm not sure yet, but I will rethink it and update this next week. For those interested, these counties are (in ranked order)
68 Gwinnett County
69 Houston County
70 Crisp County
71 Thomas County
72 Effingham County
73 Chattahoochee County
74 Murray County
75 Butts County
76 Habersham County
77 Chattooga County
78 Madison County
79 Bryan County
80 Oglethorpe County
81 Lumpkin County
82 Oconee County
83 Heard County
84 Hall County
85 Union County
86 Meriwether County
87 Bulloch County
88 Pike County
89 Tift County
90 White County
91 Bleckley County
92 Dooly County
93 Camden County
94 Franklin County
95 Lamar County
96 Morgan County
97 Polk County
98 Randolph County
99 Greene County
100 Crawford County
101 Troup County
102 Monroe County
Finally, the county rank for change in Democratic vote totals (adjusted for population) gives us this ranking, with bigger Democratic shifts toward the top.
RANK COUNTIES
1 Douglas County
2 Fayette County
3 Clay County
4 Baker County
5 Catoosa County
6 Miller County
7 Rockdale County
8 Long County
9 Seminole County
10 Lee County
11 Spalding County
12 Dade County
13 Peach County
14 Henry County
15 Jackson County
16 Dawson County
17 Haralson County
18 Walker County
19 Brantley County
20 Walton County
21 Cobb County
22 DeKalb County
23 Barrow County
24 Fulton County
25 Carroll County
26 Calhoun County
27 Coweta County
28 Terrell County
29 Muscogee County
30 Paulding County
31 Ware County
32 Stewart County
33 Bacon County
34 Clarke County
35 Newton County
36 Dougherty County
37 Floyd County
38 Worth County
39 Mitchell County
40 Clayton County
41 Banks County
42 Quitman County
43 Clinch County
44 Coffee County
45 Columbia County
46 Forsyth County
47 Wilkes County
48 Lowndes County
49 Sumter County
50 Gilmer County
51 Towns County
52 Irwin County
53 Whitfield County
54 Marion County
55 Rabun County
56 Harris County
57 Fannin County
58 Putnam County
59 Grady County
60 Brooks County
61 Glynn County
62 Jeff Davis County
63 Pickens County
64 Cherokee County
65 Wilcox County
66 Richmond County
67 Bartow County
68 Gwinnett County
69 Atkinson County
70 Houston County
71 Crisp County
72 Thomas County
73 Taylor County
74 Tattnall County
75 Effingham County
76 Chattahoochee County
77 Murray County
78 Butts County
79 Habersham County
80 Baldwin County
81 Bibb County
82 Chattooga County
83 Madison County
84 Montgomery County
85 Bryan County
86 Twiggs County
87 Burke County
88 Oglethorpe County
89 Jenkins County
90 Pierce County
91 Lumpkin County
92 Washington County
93 Oconee County
94 Heard County
95 Hall County
96 Webster County
97 Union County
98 Meriwether County
99 Colquitt County
100 Bulloch County
101 Chatham County
102 Johnson County
103 Pike County
104 Warren County
105 Tift County
106 White County
107 Laurens County
108 Schley County
109 Bleckley County
110 Pulaski County
111 Stephens County
112 Berrien County
113 Dooly County
114 Jefferson County
115 Upson County
116 McDuffie County
117 Dodge County
118 Camden County
119 Cook County
120 Liberty County
121 Talbot County
122 Franklin County
123 Lamar County
124 Wayne County
125 Morgan County
126 Hancock County
127 Wilkinson County
128 Polk County
129 Randolph County
130 Treutlen County
131 Toombs County
132 Evans County
133 Charlton County
134 Greene County
135 Ben Hill County
136 Early County
137 Turner County
138 Crawford County
139 Emanuel County
140 Wheeler County
141 Jones County
142 Elbert County
143 Macon County
144 Hart County
145 Glascock County
146 Appling County
147 Screven County
148 Candler County
149 Troup County
150 Echols County
151 Gordon County
152 Jasper County
153 Decatur County
154 Monroe County
155 Lincoln County
156 Taliaferro County
157 McIntosh County
158 Telfair County
159 Lanier County